“How you gather, manage, and use information will determine whether you win or lose.” – Bill Gates
With Industry 4.0, the Industrial Internet of Things (IIoT), and smart sensors, manufacturers have more and more data available to them. This enormous amount of Big Data available is only valuable if you can easily manage and utilize it to increase operational performance. Many data collection offerings today are cost-prohibitive, cumbersome, non-intuitive, and do not provide the tools to turn Big Data into actionable intelligence. ACI has that solution; It is called FIN- Factory Intelligence Network.
The Eureka Moment
ACI’s engineers developed FIN in 2001 at the request of a plastics manufacturer in Ohio who was desperate for an affordable, use-to-use and expandable data collection package. The data historian and SCADA software at that time were cost-prohibitive and difficult to use. Primarily needing to produce performance charts for their customer in the automotive market, they also had problems with their third shift production. They were burning approx. $1M per year in resin. Most of it the result of the third shift. Having a charting solution alone would not help with the burnt resin issues caused by temperature settings that were not in compliance.
ACI rose to the challenge. Adding a new PLC or replacing the existing legacy PLC was an unnecessary and costly answer. ACI’s Eureka moment came when we embarked on using Ethernet I/O modules which were relatively new in 2001 and writing our own data collection software. Today we call it FIN- Factory Intelligence Network. Today our customer has 19+ extrusion lines and all ancillary equipment in FIN and relies extensively on the real-time and historical data collection and web-based reporting.

FIN Features
FIN is an easy-to-use, cost-effective, yet powerful real-time process/performance tracking system that monitors critical machine, process & production variables. FIN provides the data and tools to improve operational performance by decreasing downtime, reducing waste, maintaining quality control, and improving profits.
FIN is a complete solution; there’s no need for you to buy a “suite” of products. With FIN, you can monitor thousands of data points from a single computer. FIN can gather data from any combination of newer & legacy equipment, including PLC-enabled & non-PLC-enabled machines. FIN is also easily expandable, allowing you to start small and grow with your needs.
FIN can be installed by your staff or by ACI’s factory floor engineers. Our engineers are not software guys stuck in a cubicle. They live out on the factory floor writing PLC and HMI programs and performing startups on production and process equipment. They work with your team to gather the data critical for your business.
FIN collects thousands of data points per second and stores that data on a local server with your data backed up locally or on your data center. You can view this data across your internal LAN/WAN from anywhere in the world. Our database is encrypted and can not be modified in its native format. This provides enhanced security, but data can also be shared via an ODBC connection. FIN provides simple, powerful yet intuitive trending, alarming, exporting data as a CSV file and rich reporting features. Today many companies require specific reports tailored to their needs. This is what separates FIN and ACI from everyone else. Our engineers provide tools such as web-based on-demand dashboards and easy-to-use reporting, including shift,OEE, downtime, product tracking, and more to meet your needs.
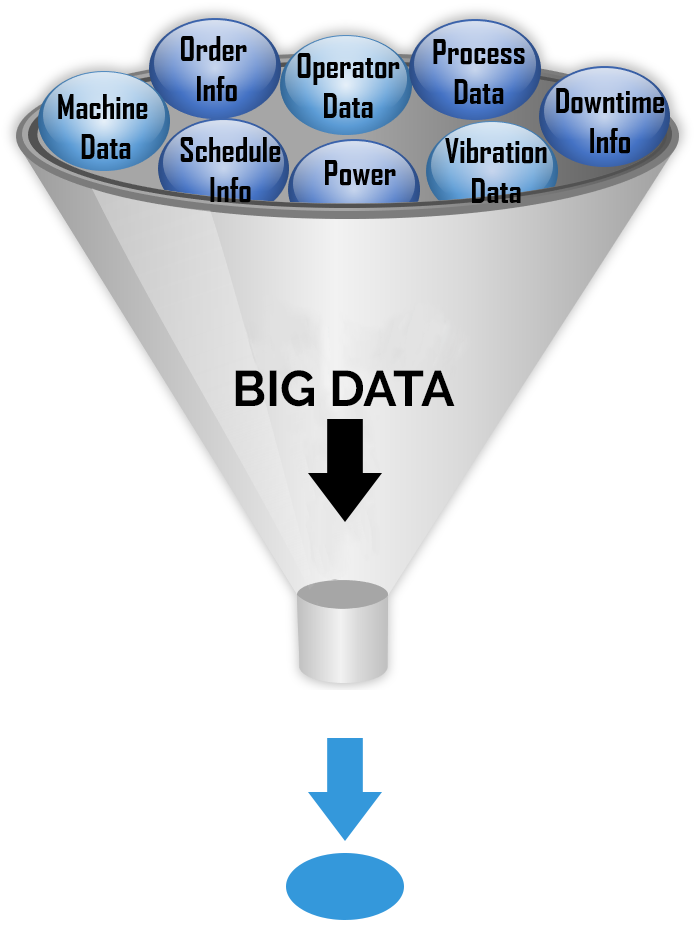
FIN Turns “Big Data” Into “Actionable Intelligence”
The enormous data available to plant management today is not the real problem. Taking that massive amount of data and making it useful IS the challenge. FIN takes overwhelming “Big Data” and turns it in to “Actionable Intelligence” by collecting “ALL” data in your plant, providing easy-to-use tools, displaying data and reports clearly, and giving management the concise data to take action to reach operational excellence.
Collect All Data
If large amounts of data are overwhelming, then why collect ALL data?
Quite often, manufacturers have many intelligent machines that gather their own data. However, all too often, what we find are “islands of information.” Each machine has data but does not share it’s data or communicate with the other machines or to plant personnel. Also, most companies have many legacy machines that have no data collection at all. However, machine or process data is not enough to produce quality reports. Collecting ALL data includes ERP, scheduling, operator information, critical maintenance information such as vibration, power, voltage, and all ancillary equipment as well. Collecting all data allows correlation between disparate machinery or conditions to be viewed, analyzed and reported.
Provide Easy-To-Use Tools
Having data is important; however, having cumbersome or lacking tools to view and analyze your data makes it virtually impossible to make educated decisions.
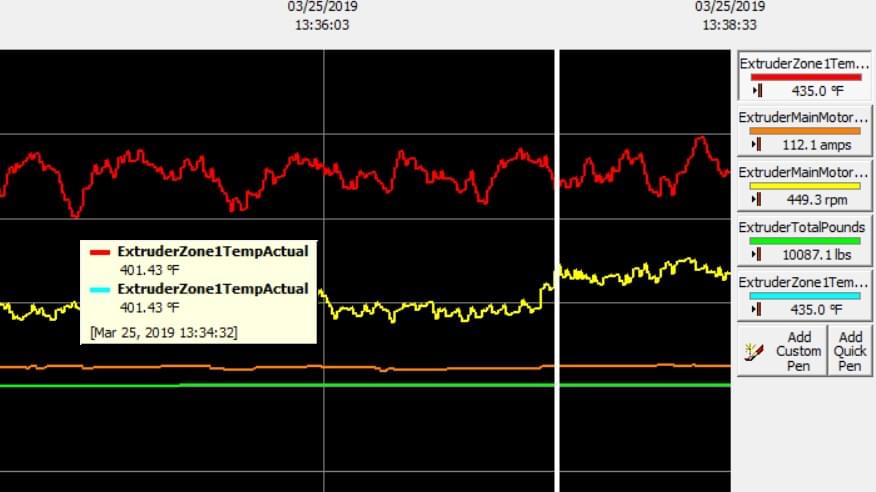
FIN provides intuitive and simple tools such as drag and drop trending. The user merely picks as many data points they wish to use and drags it to the trend or chart. FIN’s ability to trend disparate values simultaneously on one trend is powerful. It allows you to see the relationship between these values. Trends can be saved and recalled easily. Our trend also can show data down to the 1-second interval. You can see what happened 1 sec., 1 minute, 1 hour or days before an event occurred.
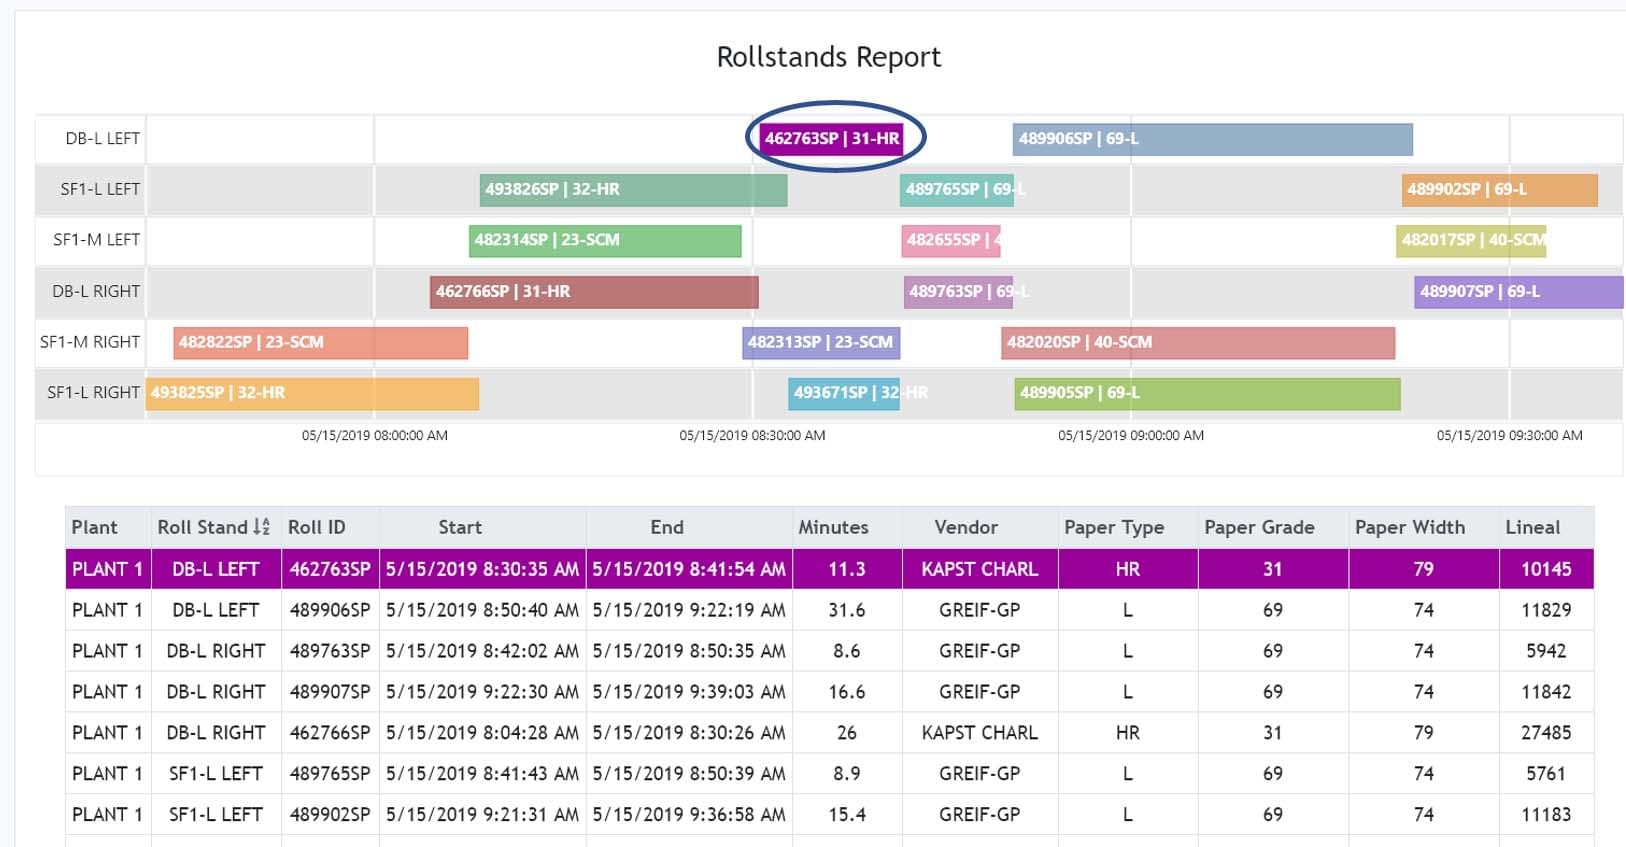
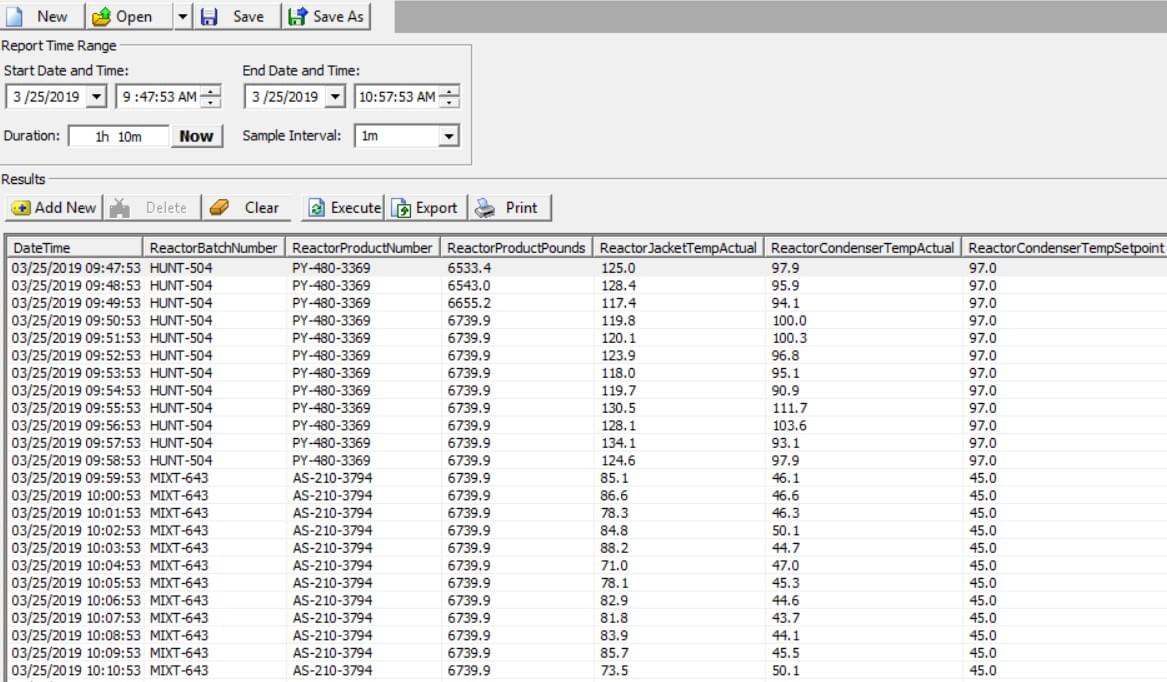
FIN’s other tools include exporting multiple data points to a CSV file in one click of a button, setting high, low, high-high, and low-low parameter alarms, and event, data, and batch reporting. Out of the box, reporting includes Event Reports which show when an event happened and for what duration. Various conditionals can be added to focus your report. Multiple data point’s values can be shown in this report. Data Reports show start time, end time, min, max and total values of multiple analog data points as well as the number of on and off occurrences and durations for digital points. Batch Reports provide reporting on a specific event (i.e. batch complete) and adding numerous other data point values based on min, max, average, etc. All reports can be exported as a CSV file in one click of a button as well as saved for quick reference.
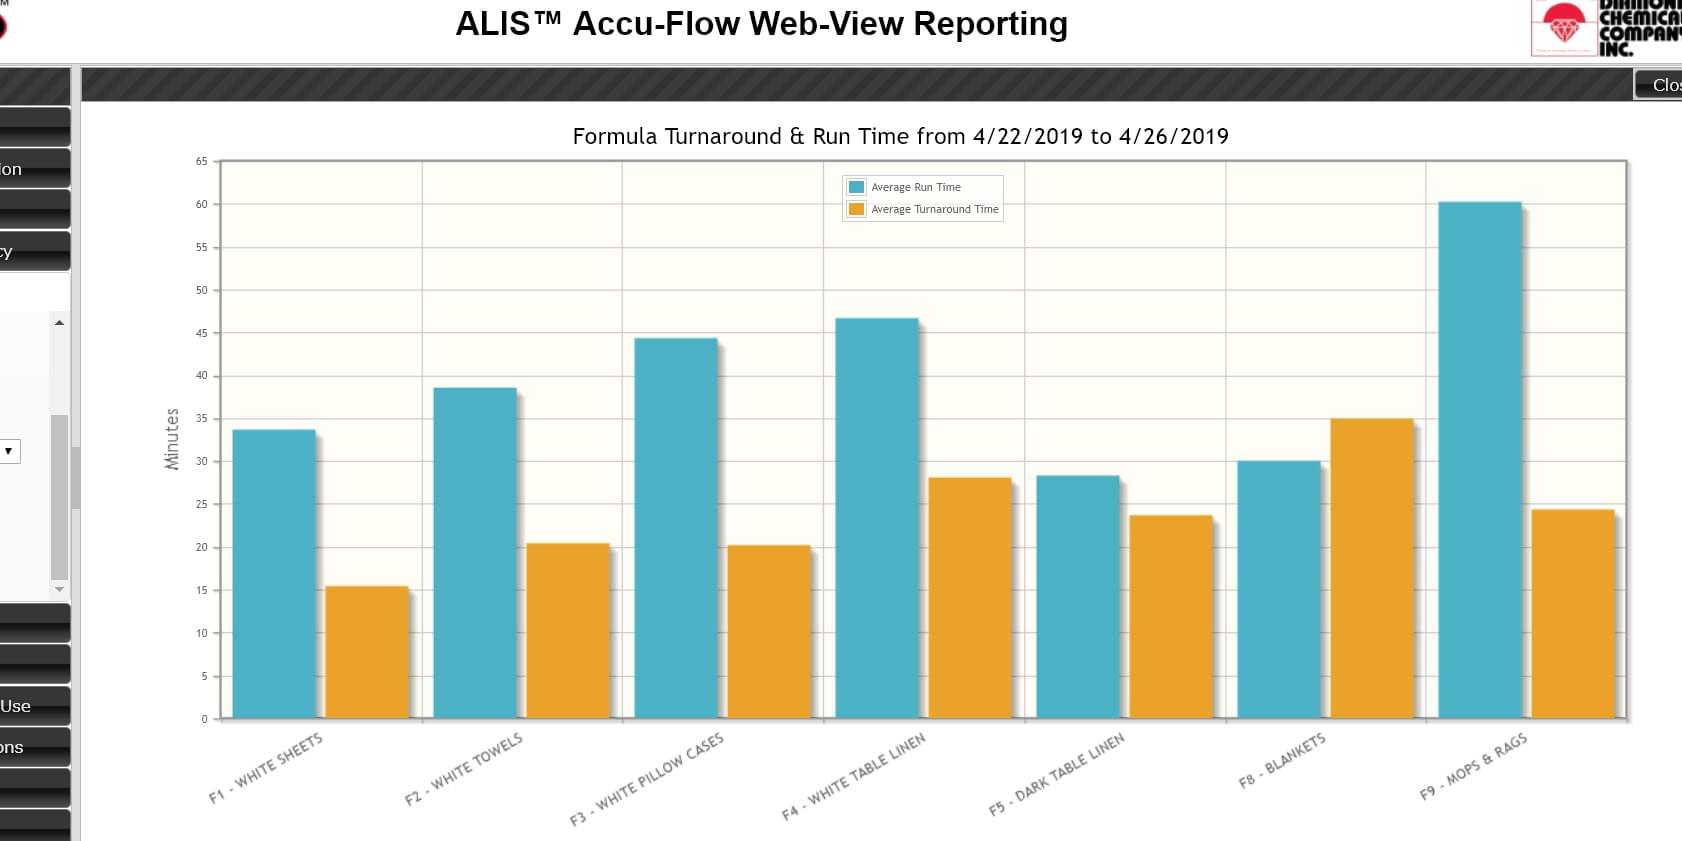
FIN’s web-based reporting customized by our team of engineers to your needs is FIN’s most valuable tool. These easily viewable reports allow viewing key data for all personnel in the plant as scoreboards, dashboards and can be customized with views specific for management. All are viewable from anywhere in the world.
Take Action
"The goal is to turn data into information and information into insight."
Carly Fiorina, Former CEO of HP
FIN turns information into actionable intelligence by providing easily viewable, precise and focused reports to all members of your organization empowering them to take action and implement measures to improve operations, procedures and performance to achieve operational excellence.